

Have you ever been frustrated by the fact that Prometheus exporters don’t export the metrics you want? I was. So I wondered how easy it is to create a custom Prometheus exporter in Python. In fact, it’s very easy to build a new Prometheus exporter using Prometheus python client.
Therefore, we’ll develop custom Prometheus exporter in Python and show how to debug it fast. For this purpose, we’ll raise a fully functional Jenkins monitoring stack using docker.
To demonstrate Jenkins monitoring using docker, the stack will include:
- Jenkins
- Jenkins initializer.
- Custom Jenkins Prometheus exporter written in Python
- Prometheus
- Grafana
Prerequisites
Install on your machine:
- docker
- docker-compose
- git
The tutorial assumes familiarity with:
- Prometheus stack
- basic git, docker and docker-compose commands.
Quickstart
We’ll jump directly into water. For this purpose, follow the below steps to raise a sample Jenkins monitoring app using docker.
- clone the repository from my github.:
git clone [email protected]:w7089/jenkins-monitoring.git cd jenkins-monitoring- build all docker images:
docker-compose build - run the monitoring stack:
docker-compose -p jenkins-monitoring up -d - note that ports
8080,3000,8000,9090are mapped to Docker host. Of course, they must be vacant on the host. - navigate to Grafana UI at http://localhost:3000/ in a browser.
- login as
admin,admin. Grafana may offer to change the default password. Skip it for now.
Finally, you should see Jenkins job count metrics as below.
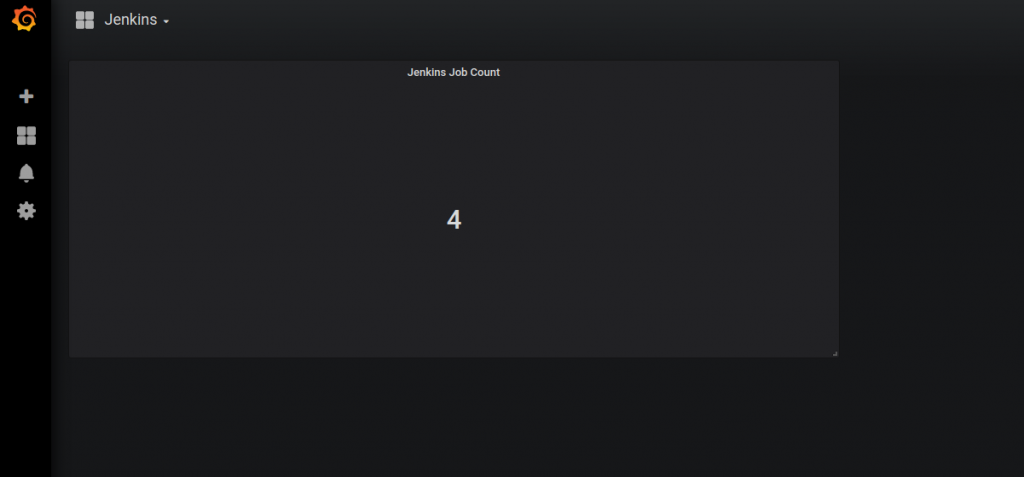
Grafana Jenkins dashboard
So what happened when we set up the stack?
Follow the below flow to find out:
- Jenkins went up.
- Jenkins initializer (one-off service) created a new Jenkins job in Jenkins via its REST api.
- custom Prometheus exporter scraped the metrics from Jenkins.
- Prometheus pulled the metrics from
/metricsendpoint of the exporter. - Grafana pulled the metrics from Prometheus and visualized them in a pre-configured dashboard.
Grafana dashboard as well as Prometheus data-source were nicely configured in configuration as code fashion 🙂
Deep Dive
I selected Jenkins as a sample web app we might want to monitor using Prometheus stack. However, we can use below flow for developing any Prometheus exporter in Python.
Below we’ll explore how to:
- develop and debug custom dockerized Jenkins Prometheus exporter in Python
- configure Prometheus datasource in code
- configure Grafana dashboards in code
Developing Jenkins Prometheus Exporter in Python
To develop Prometheus exporter we need to:
- query monitored app metrics using its APIs
- create Prometheus metrics objects and set them to scraped metrics values
- expose
/metricsendpoint. Prometheus will pull the scraped metrics from it.
Below code achieves just that and is based on official Prometheus documentation. In addition, it uses api4jenkins Python library to manage Jenkins.
import time
import random

from prometheus_client import start_http_server, Gauge
from api4jenkins import Jenkins

jenkins_client = Jenkins('http://jenkins:8080/', auth=('admin', 'admin'))

JENKINS_JOB_COUNT = Gauge('jenkins_jobs_count', "Number of Jenkins jobs")

def get_metrics():
   JENKINS_JOB_COUNT.set(len(list(jenkins_client.iter_jobs())))


if __name__ == '__main__':
    # Start up the server to expose the metrics.
    start_http_server(8000)
    while True:
        get_metrics()
        time.sleep(random.randrange(1,10))
Let’s go over exporter’s code below.
Getting Jenkins Jobs count
Below code uses Jenkins Python Client to get Jenkins jobs count.
from api4jenkins import Jenkins

jenkins_client = Jenkins('http://jenkins:8080/', auth=('admin', 'admin'))
len(list(jenkins_client.iter_jobs()))
Create Prometheus metrics objects
Then we create Prometheus metrics object of type Gauge and set it to scraped jobs count.
JENKINS_JOB_COUNT = Gauge('jenkins_jobs_count', "Number of Jenkins jobs")
JENKINS_JOB_COUNT.set(len(list(jenkins_client.iter_jobs())))
Expose /metrics endpoint
In fact, we get this functionality for free from Prometheus Python client. After we start HTTP server, /metrics endpoint is exposed for us.
start_http_server(8000)Debugging Dockerized Jenkins Prometheus Exporter
Usually, cycle of debugging containerized web app involves below steps:
- finding a bug in some app use case
- hopefully fixing the bug
- building app docker image containing the fix
- deploying the new image to some environment (dev/test/staging)
- testing the fix is working by reproducing the faulty use case
As a result, the process can be long and tiresome. Especially, if rebuilding Docker image takes a long time.
Alternatively, it would be great if we could fix app’s source code in our development workspace and then get immediate feedback on whether the fix is working.
In fact, combination of Nodemon and Docker volumes allows just that 🙂
Wait, what about debugging Python code in Docker container? Of course, it’s doable. Yet, we’ll cover this in a different post. In the meantime, we’ll use Nodemon. I truly believe, that using Nodemon is a simpler way when it’s possible.
Nodemon monitors workspace for changes in a web app source code. It automatically restarts the web server in case of detecting changes.
While Nodemon being npm package is usually used while developing Node.js web apps, it perfectly fits our purpose. Hence, we’ll use it for live reload of containerized Python HTTP server with updated exporter’s code.
How to live reload Jenkins exporter’s source code inside the container?
Follow below steps to add live reload functionality to Prometheus exporter:
- install Nodemon in exporter’s Dockerfile:
RUN curl -fsSL https://deb.nodesource.com/setup_lts.x | bash - && \
    apt-get install -yq nodejs

RUN npm i -g nodemon- map exporter’s source code to exporter container using Docker Volume:
  jenkins-exporter:
    ...
    volumes:
- ./jenkins-exporter/exporter.py:/usr/src/app/exporter.py- execute
exporter.pyusing Nodemon in exporter’s Dockerfile:
# CMD python3 exporter.py
CMD nodemon --exec python3 exporter.py- The most interesting part comes now 🙂 Modify exporter’s source code in your workspace while the exporter container is running. For this purpose, set Jenkins jobs count to 100000.
JENKINS_JOB_COUNT.set(1000000)- navigate to Grafana UI and notice that the new value was scraped.
- observe the log of the exporter to see Nodemon in action:
jenkins-monitoring$ docker-compose -p jenkins-monitoring logs jenkins-exporter
Attaching to jenkinsmonitoring_jenkins-exporter_1
jenkins-exporter_1     | [nodemon] 2.0.12
jenkins-exporter_1     | [nodemon] to restart at any time, enter `rs`
jenkins-exporter_1     | [nodemon] watching path(s): *.*
jenkins-exporter_1     | [nodemon] watching extensions: py,json
jenkins-exporter_1     | [nodemon] starting `python3 exporter.py`
jenkins-exporter_1     | [nodemon] restarting due to changes...
Configure Prometheus and Grafana in configuration as code fashion
Configuration as code is cool because it allows you to configure applications in code. In addition, we can track the configuration changes in source control. Moreover, it saves the need to configure the applications manually each time we need to install them on a new environment.
Of course, Prometheus and Grafana is configured in code in our demo. Keep reading if you want to understand how we achieved that 🙂
Configure Prometheus data source
- Prometheus configuration is pretty simple. Firstly, we configured Prometheus scrape target (jenkins-exporter:8000). Then, we specified its endpoint (/metrics) in jenkins-monitoring/prometheus/prometheus.yaml.
global:
  scrape_interval: 15s
scrape_configs:
  - job_name: 'jenkins'
    metrics_path: '/metrics'
    scheme: http
    static_configs:
- targets: ['jenkins-exporter:8000']- we copied Prometheus scrape configuration file in its Dockerfile.
COPY prometheus.yaml /etc/prometheus/prometheus.ymlConfigure Grafana dashboards
Grafana Prometheus datasource and dashboard are configured similarly.
- data-source is configured in jenkins-monitoring/grafana/datasources/prometheus.yaml
apiVersion: 1

datasources:
  - name: Prometheus
    type: prometheus
    access: proxy
    url: http://prometheus:9090
editable: true- dashboards path is configured in jenkins-monitoring/grafana/dashboards/dashboard-provider.yaml
apiVersion: 1

providers:
  - name: 'default'
    folder: ''
    type: file
    disableDeletion: true
    options:
      path: /var/lib/grafana/dashboards
You may wonder how Grafana dashboard was set up. Simple 🙂 Firstly, I created Jenkins dashboard manually in Grafana and exported it as json. Then, I copied the exported json to jenkins-monitoring/grafana/dashboards/Jenkins.json. Finally, we copy Grafana configuration in its Dockerfile:
...
COPY datasources/prometheus.yaml /etc/grafana/provisioning/datasources/
COPY dashboards/dashboard-provider.yaml /etc/grafana/provisioning/dashboards/
COPY dashboards/*.json /var/lib/grafana/dashboards/
Summary
If you read this far, I hope you enjoyed and the post helped you to save time. As always, feel free to share. You might also be interested to learn how to add health check to Prometheus and how to monitor Spring Boot Apps using Prometheus on Kubernetes.
Bonus:
Recommended courses on Pluralsight:
- Getting Started with Prometheus
- Monitoring Key Systems with Prometheus Exporters
- Monitoring Containerized Application Health with Docker
Sign up using this link to get exclusive discounts like 50% off your first month or 15% off an annual subscription)
Recommended books on Amazon:
Prometheus: Up & Running: Infrastructure and Application Performance Monitoring